+1 (410) 451-4297
connect@compasslanguages.com


Localization Strategy
The Three KPIs That Should Replace Cost-per-Word in Enterprise Localization
Enterprise localization is still measured by cost-per-word across the industry, and that metric is the reason so many international growth programs underperform without anyone being able to explain why.
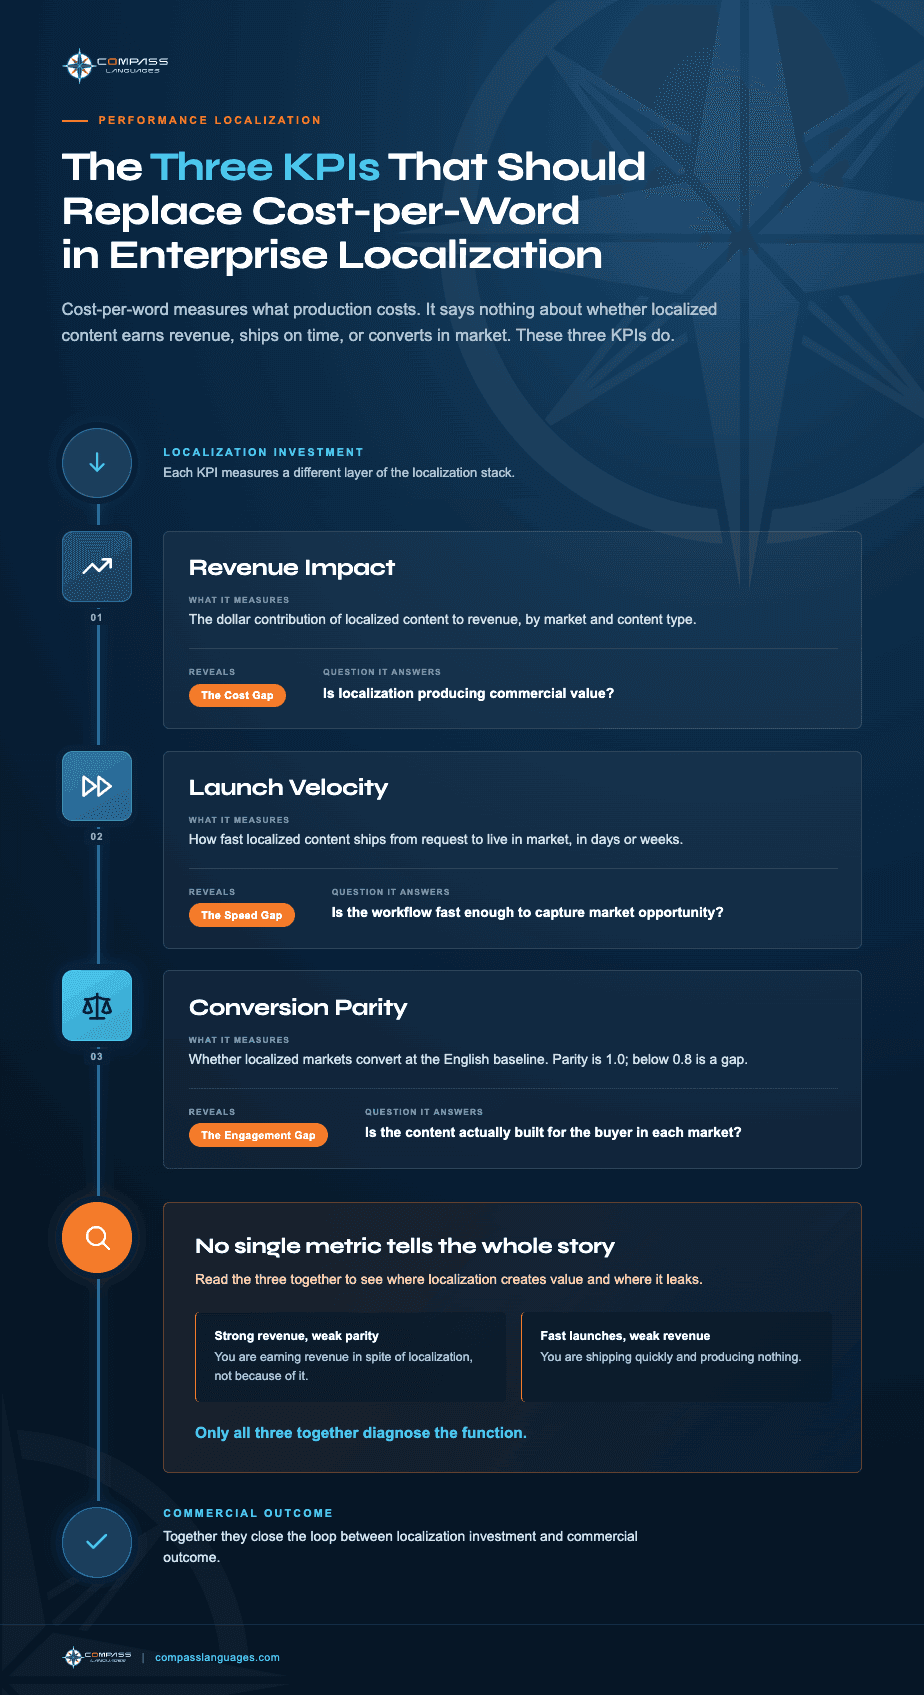
Cost-per-word tells you what production costs. It says nothing about whether the localized content actually generates revenue, ships in time to capture market opportunity, or converts in the markets it was built for. The three KPIs that do tell you those things, and the ones that should replace cost-per-word as the primary localization KPIs for enterprise teams, are revenue impact, launch velocity, and conversion parity.
A VP of eCommerce gets the quarterly localization invoice. Cost-per-word came in two cents below the contracted benchmark, procurement signed off, and on paper everything looked clean. Three months later, the French market is converting at half the English rate, the Japanese launch slipped six weeks, and ROAS on the German paid campaigns is dropping. While the invoice said everything was working, the business is telling a completely different story.
Cost-per-word is the metric being optimized. International growth is the outcome being lost. The disconnect is structural, and it's costing enterprise localization programs real revenue every quarter.
Why Cost-per-Word Stopped Working
Cost-per-word made sense as a measurement frame when localization meant taking a document, translating it, and shipping it. The work was a clean transaction where a vendor produced X words at Y rate, the procurement team measured the unit cost, and the output went live with a predictable level of quality. For years, the metric matched the function and that was good enough.
In 2026, localization is no longer a transaction. It's an orchestration of translation, voice, video, subtitles, regional QA, cultural adaptation, payment localization, search behavior, and platform integration. Each layer determines whether the localized content actually performs in market. A perfectly translated PDP with the wrong currency display, missing regional payment options, and trust signals built for the English audience will underperform every metric that matters, regardless of how clean the cost-per-word came in.
A metric that measures one slice of a multi-layer system cannot tell you whether the system is working. Cost-per-word at $0.18 versus $0.22 is a procurement question. Whether the localized PDP converts at parity with the English baseline is a business question. The two aren't connected, and treating them as if they are is exactly what creates the gap between localization spend and revenue outcomes.
The Three KPIs That Replace Cost-per-Word
Three KPIs replace cost-per-word as the primary measures of enterprise localization performance. Each one measures a different layer of the function, and together they close the loop between localization investment and commercial outcomes.
Revenue Impact
Revenue impact measures the dollar contribution of localized content to commercial outcomes in each market. Not impressions or click-through rates, but actual revenue generated from localized assets, attributed by market and by content type.
This is the only metric that ties localization spend to business value in a way the rest of the organization can evaluate. A localized PDP driving $400K in revenue at $8K to localize is a 50x return, and that math changes how budget conversations land. If the same PDP costs $8K and generates $20K, the conversation shifts to whether the workflow is producing the right output, which is a workflow question, not a cost-per-word question.
Measuring revenue impact requires attribution by localized asset and market. Enterprise teams usually track this for English content already, so extending the same attribution to non-English markets is a matter of connecting localization workflow data to commercial data.
Launch Velocity
Launch velocity measures how fast localized content can ship from request to live in market. Measured in days or weeks per launch cycle, tracked over time by content type and by language.
In global markets, time-to-launch is competitive advantage. When localization sits downstream from product and marketing, every campaign launch waits for translation cycles that can stretch from days into weeks. Regional teams get content too late to capitalize on local moments, and competitors who launch faster capture demand that takes years to win back. Tracking launch velocity is straightforward: benchmark the time from a localization request being submitted to the asset going live in market against the English launch timeline. A market consistently launching three to six weeks behind English is bleeding share, and once that's visible, the workflow design conversation becomes a different one.
Conversion Parity
Conversion parity measures whether localized markets convert at the same rate as the English baseline. Calculated as conversion rate in each non-English market divided by conversion rate in the English market. Parity is 1.0, and anything below is a gap. The size of the gap tells you how much the experience is still built for the wrong buyer.
Parity is the only metric that tells you whether the localization actually worked. A localized site converting at 0.5 of the English baseline is not a localized site. It's a translated site sitting on top of an experience that was never adapted to the buyer in that market. The translation might be flawless while the currency display, payment methods, trust signals, local search behavior, and cultural context are still built for someone else. Parity surfaces this immediately, which is why legacy localization programs tend to avoid measuring it.
Tracking conversion parity requires the same conversion data the team already has, just compared differently. Conversion rate by market for the same products, same campaigns, same time periods, with each non-English market compared against the English baseline. A persistent parity score below 0.8 signals something in the experience is still built for the wrong audience, and the investigation usually starts with the layers below translation.
Why the Three KPIs Work Together
Each of the three KPIs measures a different layer of the localization stack, and reading them together is what reveals where the function is producing value and where it's leaking. Revenue impact tells you whether localization is producing commercial value. Launch velocity tells you whether the workflow is fast enough to capture market opportunity. Conversion parity tells you whether the content is actually built for the buyer in each market.
A program scoring well on revenue impact but poorly on conversion parity is producing revenue in spite of the localization, not because of it. When a program scores well on launch velocity but poorly on revenue impact, the function is shipping fast and producing nothing. The pattern across the three metrics diagnoses the function.
These three KPIs map directly to the three vectors of the KPI Gap that Compass's Performance Localization framework identifies. Revenue impact reveals the Cost Gap, launch velocity reveals the Speed Gap, and conversion parity reveals the Engagement Gap. Together they close the loop between localization investment and commercial outcome.
How to Make the Shift
The shift from cost-per-word to the three KPIs is a measurement decision before it's a workflow decision. KPIs come first, and the workflow gets built or rebuilt around them. The moves are practical:
Audit current localization performance against the three KPIs. The data usually exists, and the connection between localization workflow data and commercial data is what needs to be built.
Set conversion parity as the operating standard. Any non-English market converting below 0.8 of the English baseline gets investigated as a performance issue, not a market issue.
Rebuild reporting around revenue impact and launch velocity. Cost-per-word and turnaround time become supporting procurement metrics.
Shift the procurement conversation from "what's your rate" to "what KPIs do you measure against." Vendors who can't answer that question are the wrong partners for the next decade.
Tie localization budgets to commercial outcomes, not production volumes.
The shift is harder than it sounds. It requires localization, marketing, and procurement to align on a shared measurement framework. Companies making the shift are seeing the kind of commercial returns that justify the effort. The ones that aren't are watching their international growth stall while their localization invoices stay on budget.
Where Compass Comes In
At Compass, we've watched the cost-per-word ceiling get hit in real time across hundreds of enterprise engagements. Vendors who keep optimizing for cheaper words are the same ones leaving revenue, speed, and conversion on the table for clients who hired them to do the opposite. The shift from cost-per-word measurement to a KPI framework is what separates a localization function operating as procurement spend from one operating as commercial infrastructure.
Our process starts by auditing the KPI Gap. We benchmark performance by market across revenue impact, launch velocity, and conversion parity, then connect localization spend to the commercial outcomes the data reveals. From there, we rebuild the workflow around commercial KPIs, configuring AI tools, human expert layers, and quality tiers based on what each market needs to convert. We integrate directly into client systems (CMS, PIM, CRM) so reporting on the three KPIs runs day-to-day.
That approach is backed by the scale to deliver it: more than 25,000 projects completed, over 200 languages supported, a network of 2,700-plus linguists, and ISO 9001:2015 certification. Client engagements consistently produce 50% reductions in localization costs, 40% faster launch cycles, and 100% increases in social engagement when the workflow gets rebuilt around the three KPIs.
What Success Looks Like
When the three KPIs replace cost-per-word as the primary measure of localization performance, the entire conversation around the function shifts:
Localization gets measured the way the business measures everything else, with commercial outcomes as the headline metrics.
Cost-per-word demotes from primary success metric to procurement detail, where it belongs.
Revenue impact, launch velocity, and conversion parity reporting ties localization spend directly to outcomes.
A quarterly business review where localization shows up as a growth driver, not a line item to defend.
The Question Worth Asking
Cost-per-word measures what localization costs. Revenue impact, launch velocity, and conversion parity measure whether it's working. The shift from one to the other is the foundation of Performance Localization, and it's the operating model the strongest enterprise programs are already moving toward. Next time the quarterly localization invoice comes across the desk, the question worth asking is whether the three KPIs that actually matter are being measured at all.
Download the full Performance Localization framework.
Our white paper, Performance Localization: The Modern Operating Model for Global Enterprise Growth, lays out the KPI Gap analysis, the three components of a Performance Localization system, and the specific recommendations for enterprise leaders. Read it free at compasslanguages.com.
Frequently Asked Questions
Why is cost-per-word a problem as a localization metric?
Cost-per-word measures the cost of one slice of a multi-layer system. It tells you what production costs but not whether the localized content actually works in market. Modern localization includes translation, voice, video, subtitles, regional QA, cultural adaptation, payment localization, and platform integration. A metric that ignores all those layers cannot tell you whether the program is producing value, which is why cost-per-word now functions as a procurement metric, not a performance metric.
How do you measure conversion parity in localized markets?
Conversion parity is the conversion rate in each non-English market divided by the conversion rate in the English market. Parity is 1.0. A market converting at 0.5 of the English baseline has a 50% parity gap. Enterprise teams already track conversion rate by market and just need to compare them against the English baseline to surface the parity score. A persistent score below 0.8 signals the experience is still built for the wrong audience.
What's the relationship between launch velocity and revenue in localization?
In global markets, time-to-launch is competitive advantage. When localized content ships three to six weeks behind the English version, the company misses local market moments and cedes share to faster competitors. Launch velocity, measured as days from request to live in market, is the KPI that exposes this hidden revenue loss before it shows up in a single quarter's revenue report.
Should enterprise localization teams replace cost-per-word entirely or track both?
Cost-per-word still has value as a procurement metric for budgeting and vendor comparison. Trouble starts when it becomes the primary success metric for the entire localization program. The shift is to track revenue impact, launch velocity, and conversion parity as the primary KPIs, with cost-per-word demoted to a supporting procurement metric that informs vendor selection without driving overall performance evaluation.

Learn more
Contact
connect@compasslanguages.com
+1 (410) 451-4297
147 Old Solomons Island Rd, #302
Annapolis, MD 21401
Copyright © 2026 Compass Languages. All Rights Reserved